Wenqi Chen

A Bachelor's degree in Statistics and Data Science from the University of Wisconsin-Madison
Currently pursuing a Master's degree in Data Science at the University of Pennsylvania
Portfolio
Selected Projects in Data Science and Data Engineering
In Progress (Update: 01/15/2025)
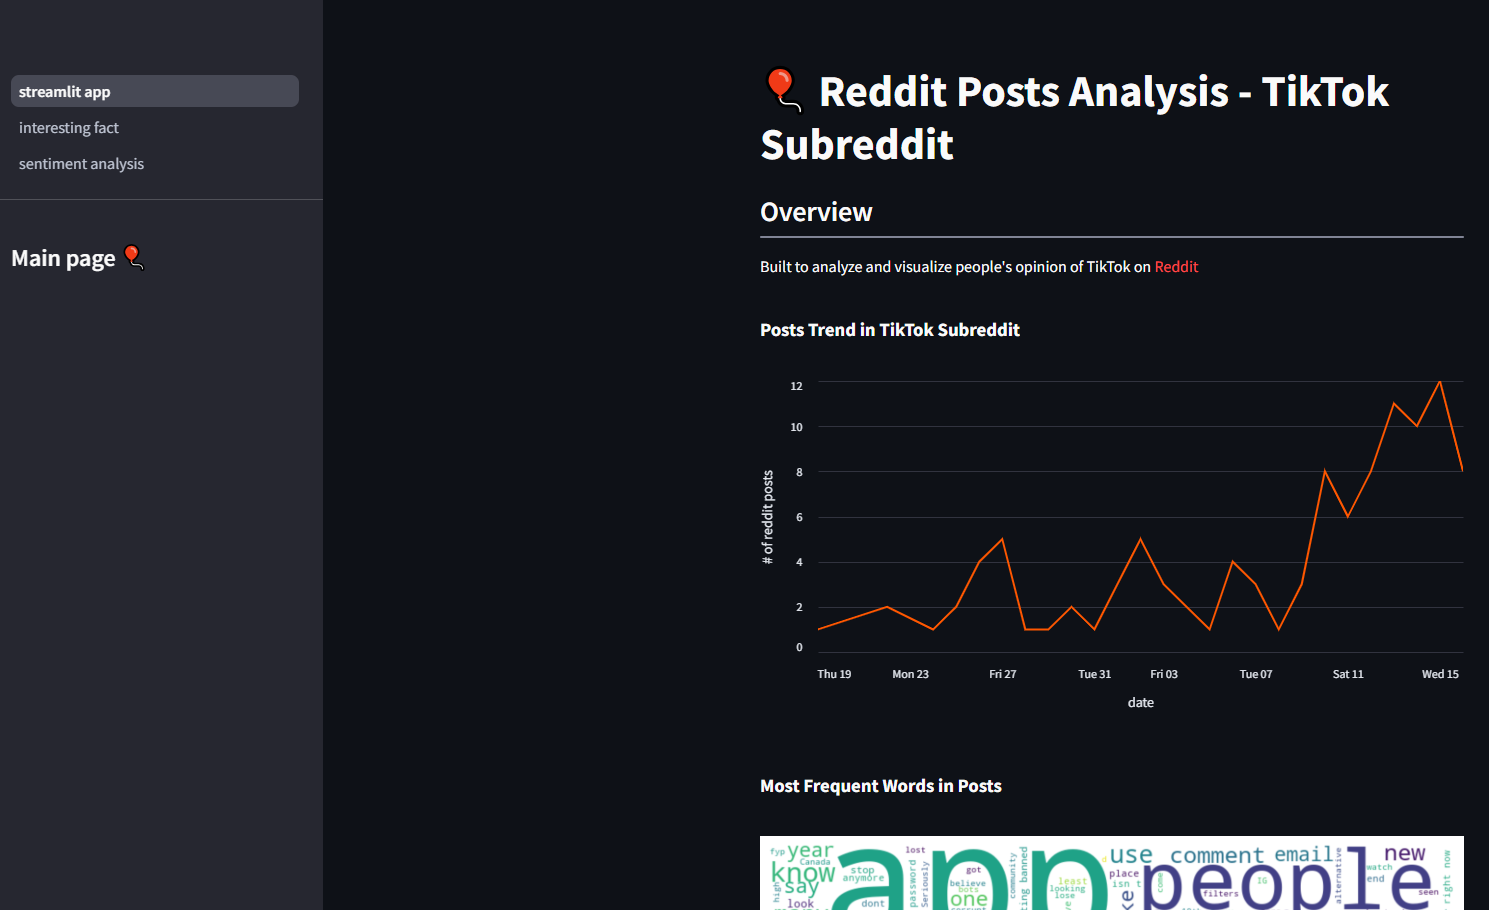
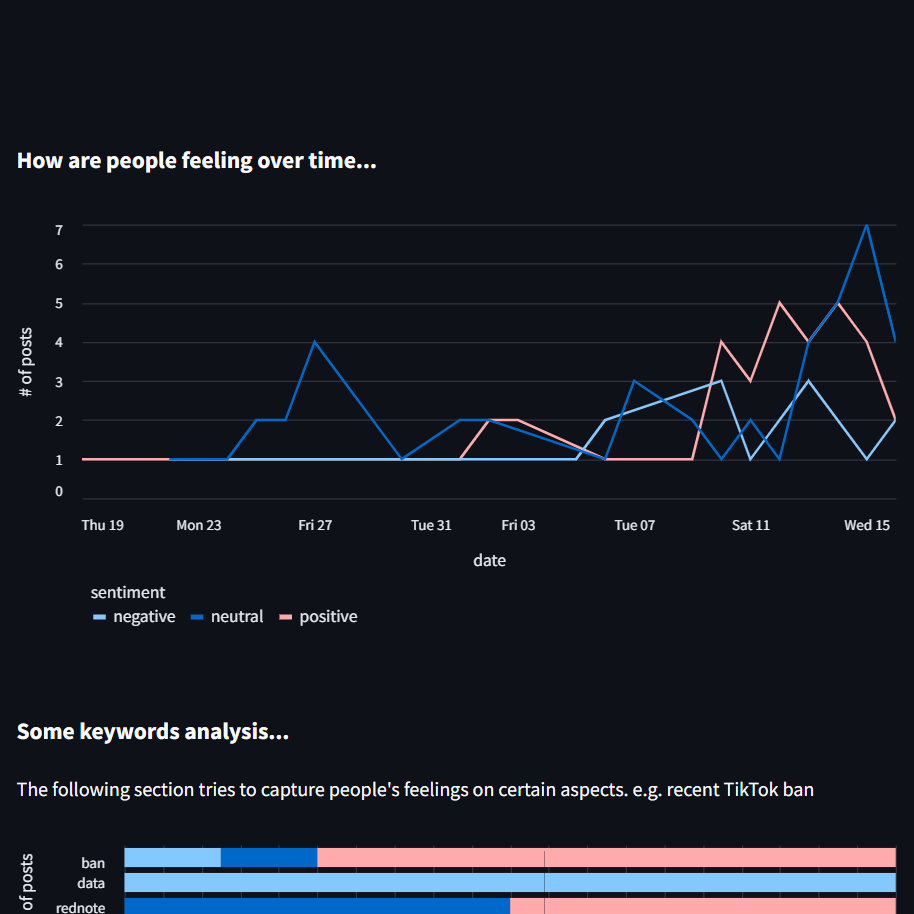
Project 7. Data Pipeline for Reddit Posts Analysis
This project is first created to understand people’s opinions on recent TikTok ban. It was later expended to understand the overall trend of TikTok subreddit. Python scripts were created to scrape reddit posts information, details can be found in this repo. Scraped data was then visualized in a streamlit app here (working on integrating for a real-pipeline)
![]()
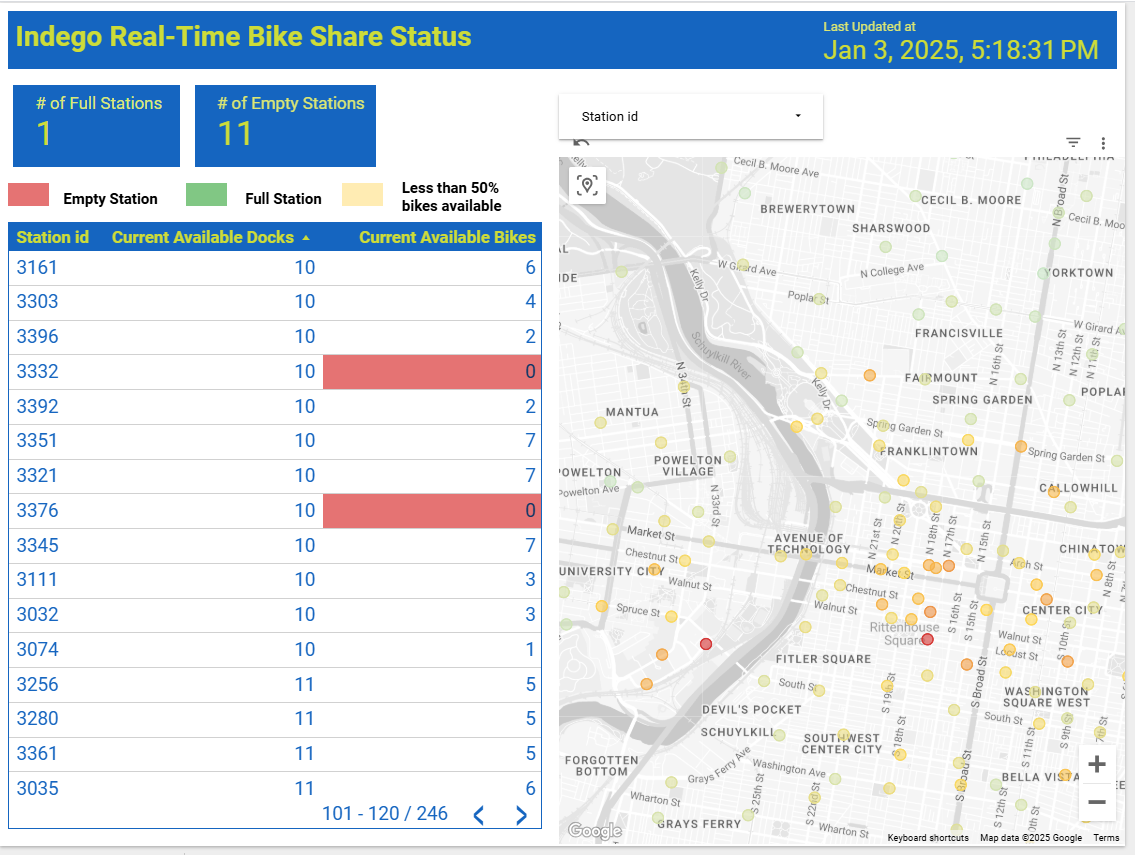
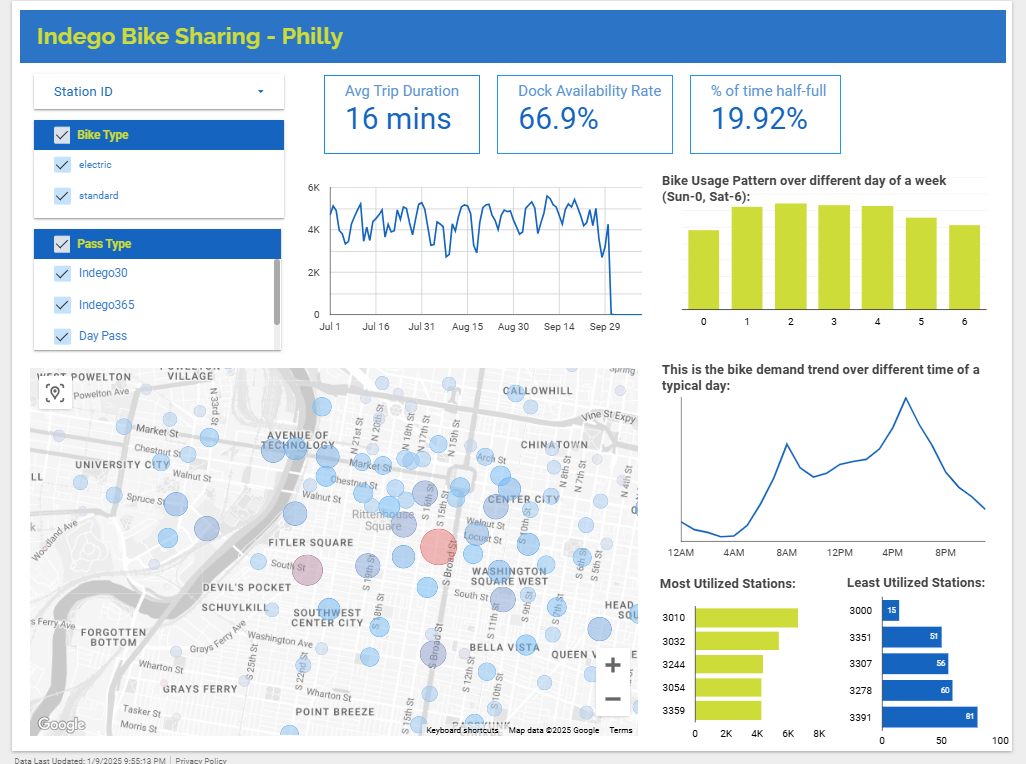
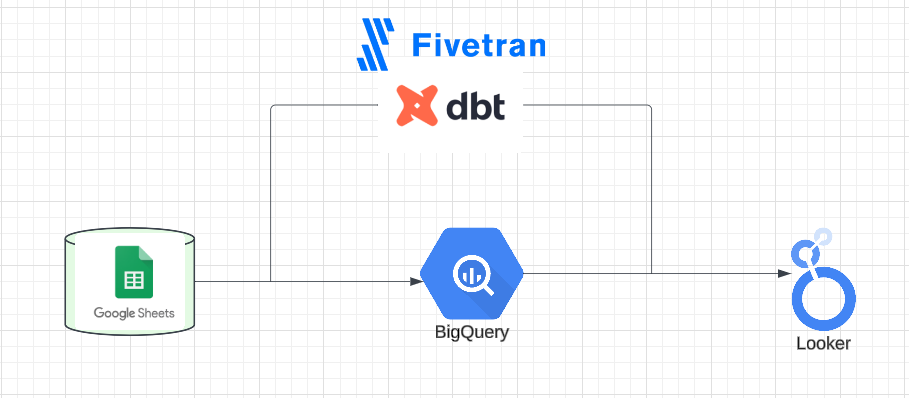
Project 6. Data Pipeline for Bike Sharing in Philadelphia
The purpose of this project is to understand the usage pattern of shared bikes in Philadelphia. Details can be found the this github repo.
Data Pipeline Architecture
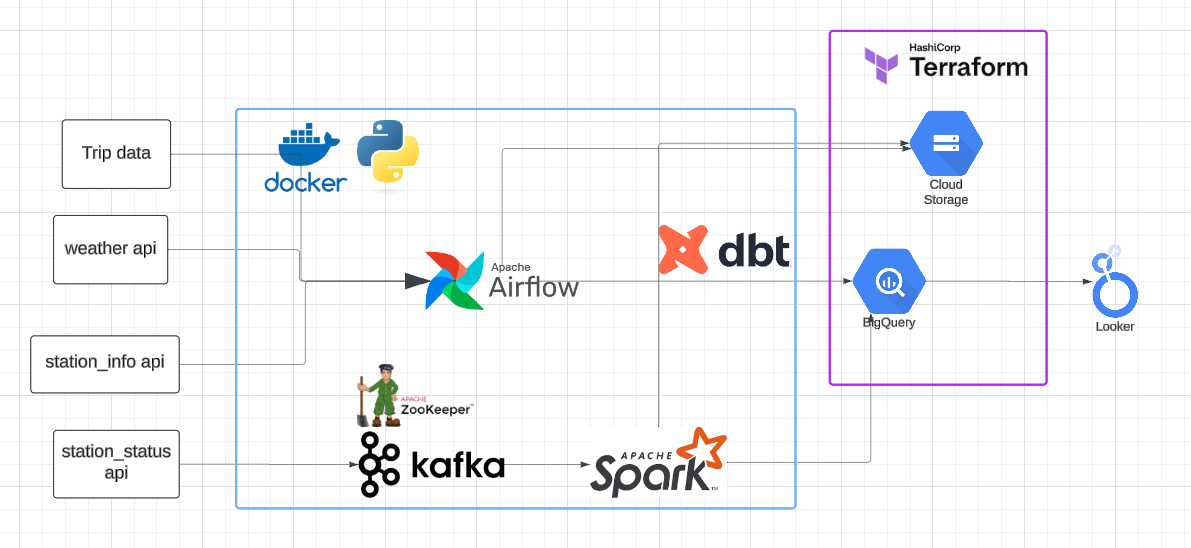
The following tools are used:
- Airflow: workflow orchestration
- Bigquery: data warehouse
- Cloud storage: data lake
- Kafka + Pyspark: real-time data ingestion
- terraform: infrastructure management
- Looker: visualization
Dashboards
real-time monitoring dashboard
historical data dashboard
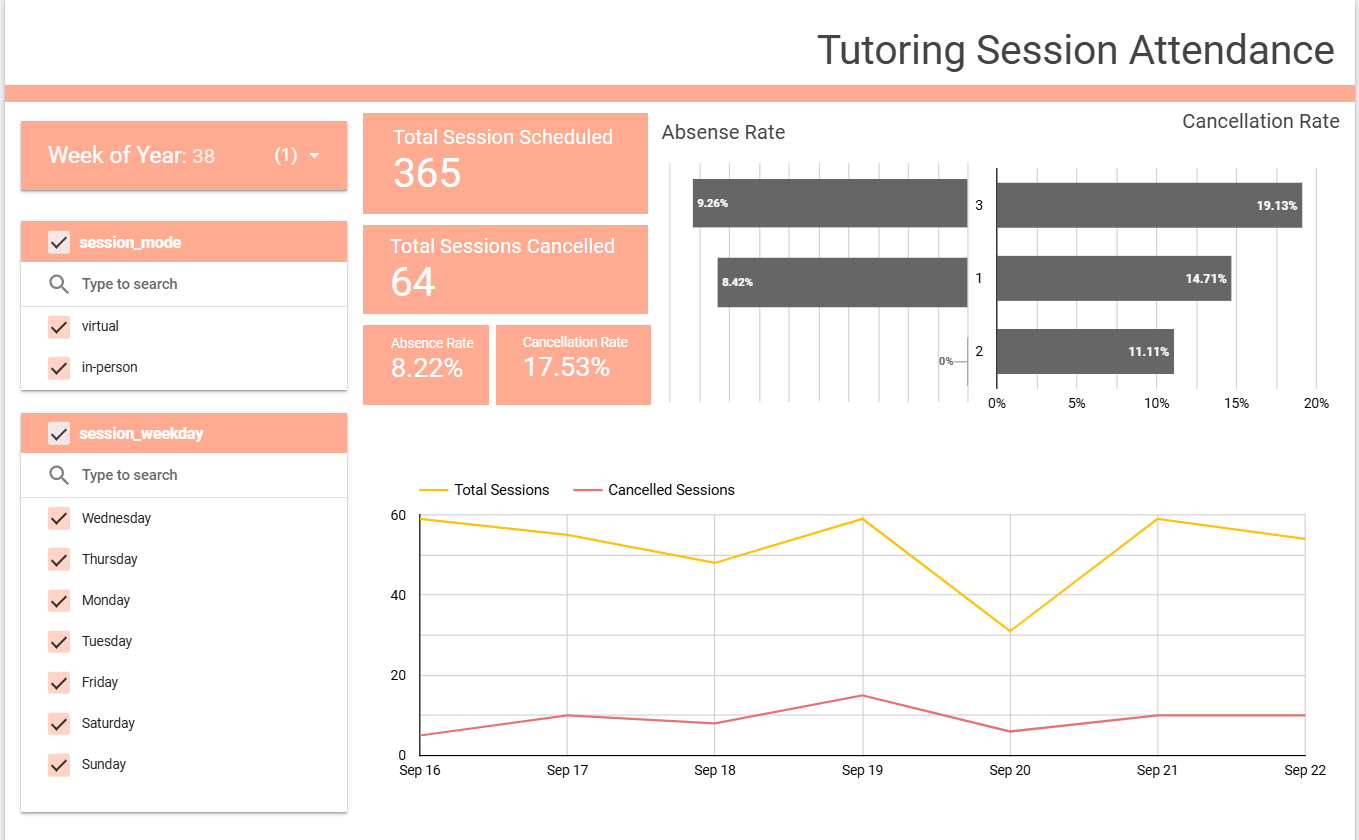
Project 5. Data Pipeline for Tutoring Session Attendance
The pipeline specification document can be found here: docs This pipeline is designed to ingest data from Google Sheet and load it into BigQuery. The dashboard is built using Looker Studio to track metrics such as absence rate and cancellation rate.
Data Pipeline Architecture
Dashboard
dashboard can be accessed here: looker dashboard
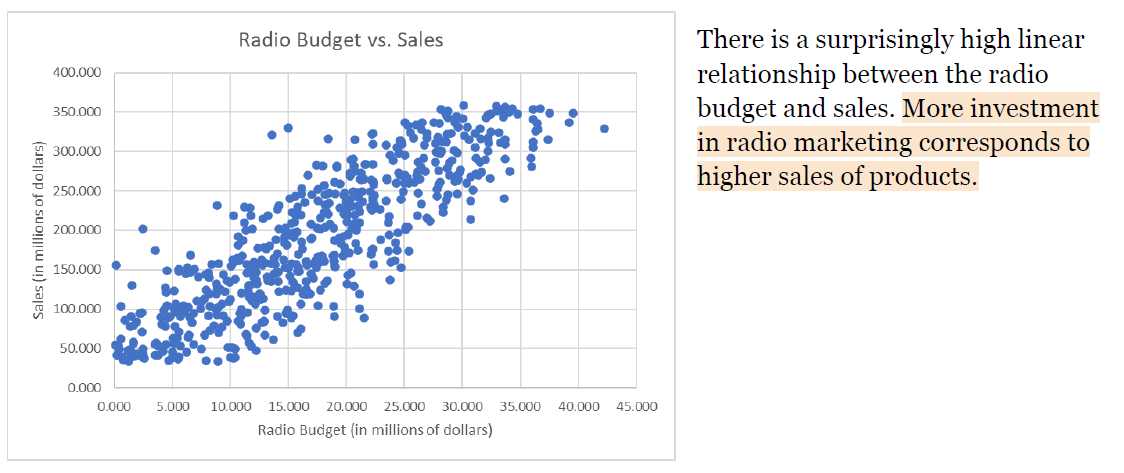
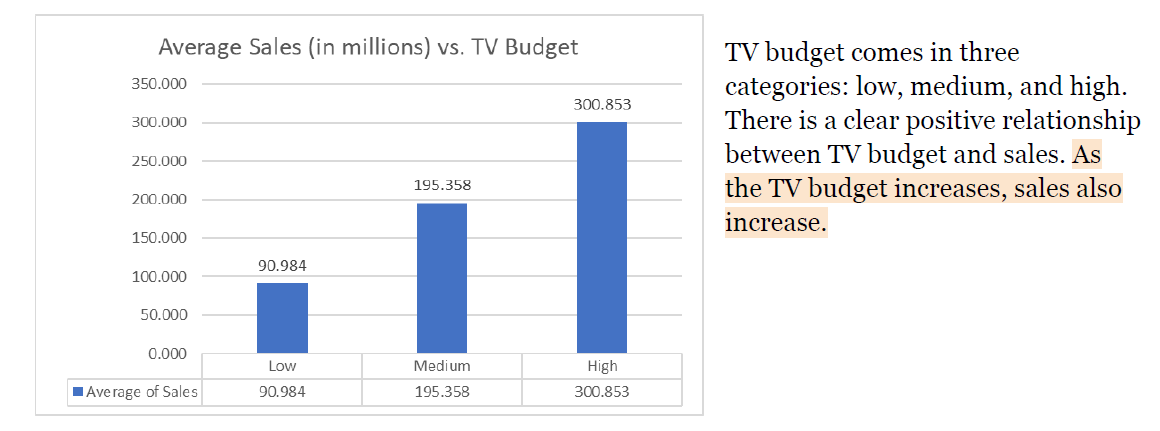
Project 4. What Channels Are More Effective in Marketing Promotion: TV, Radio, or Social Media? (Excel)
analysis report can be found here: pdf
This short analysis aims to assess the effectiveness of different marketing channels.
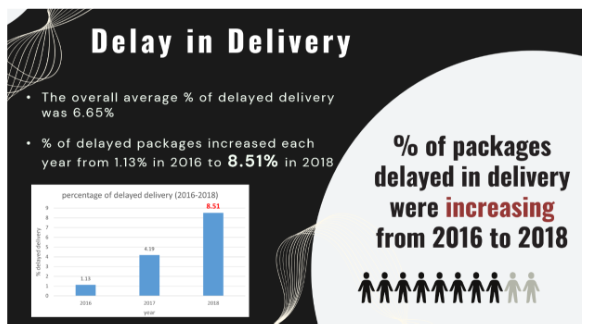
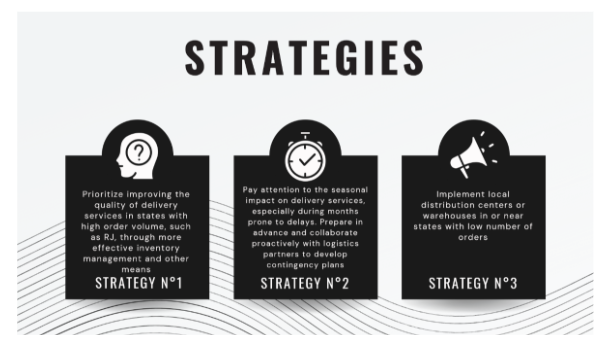
Project 3. Enhancing Customer Satisfaction: An Analysis of Olist’s Package Delivery (SQL)
analysis report can be found here: pdf
Olist is one of the biggest e-commerce platforms in Brazil. The primary objectives of this analysis are to understand the delivery services offered by Olist’s logistics partners, assess their delivery performance, and develop strategies to improve the services and boost customer satisfaction.
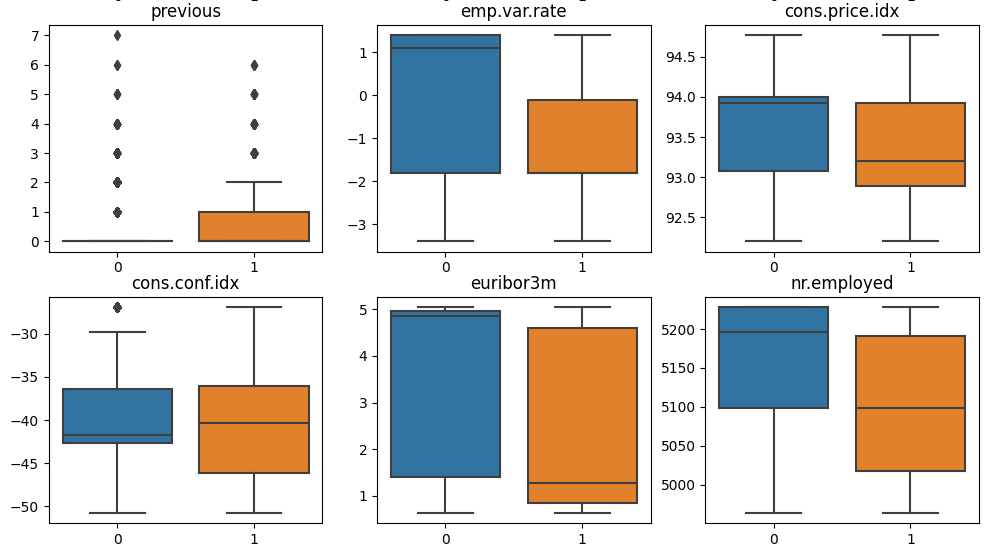
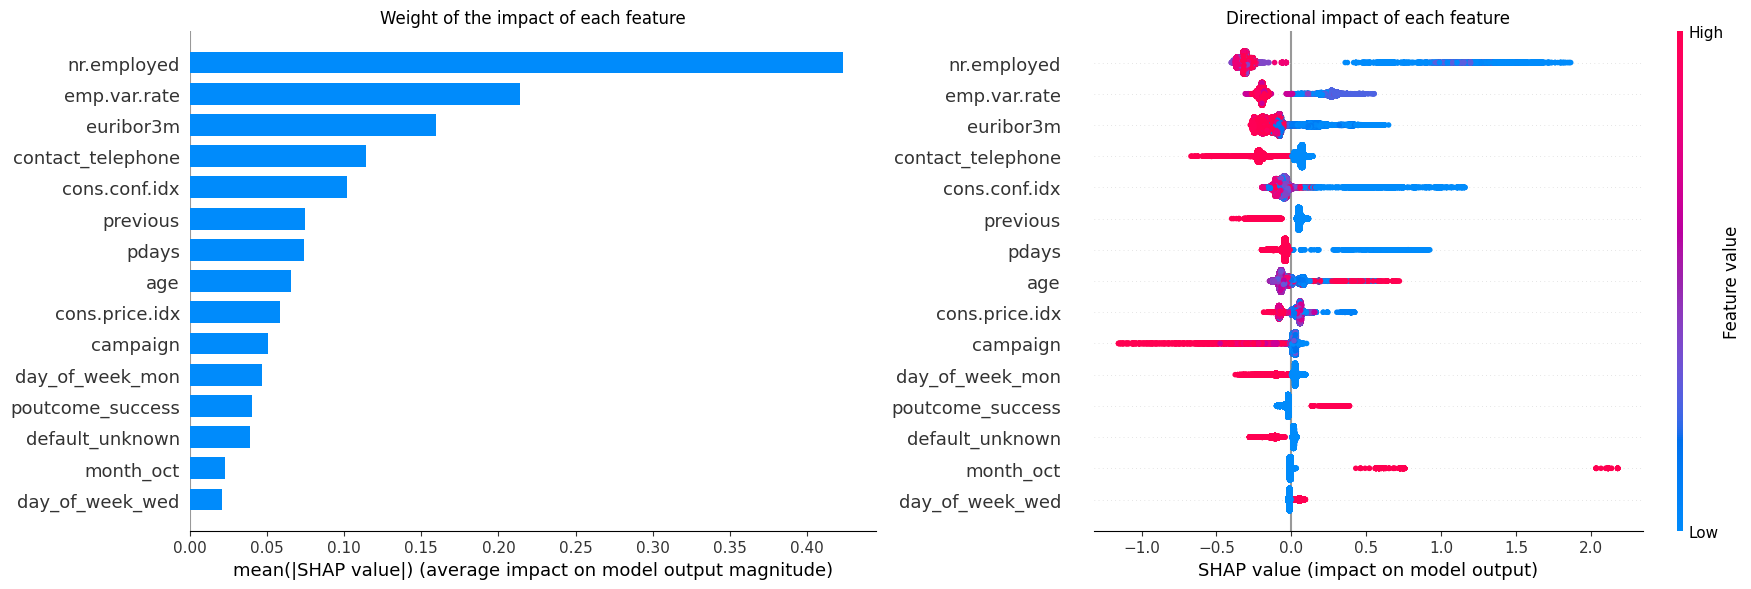
Project 2. Term Deposit Subscription Prediction (Classification, Python)
Notebook can be found here: Google Colab
This notebook analyzed a direct marketing campaign of Portuguese Bank and built a classifier to predict if an individual will subscribe to a term deposit or not.
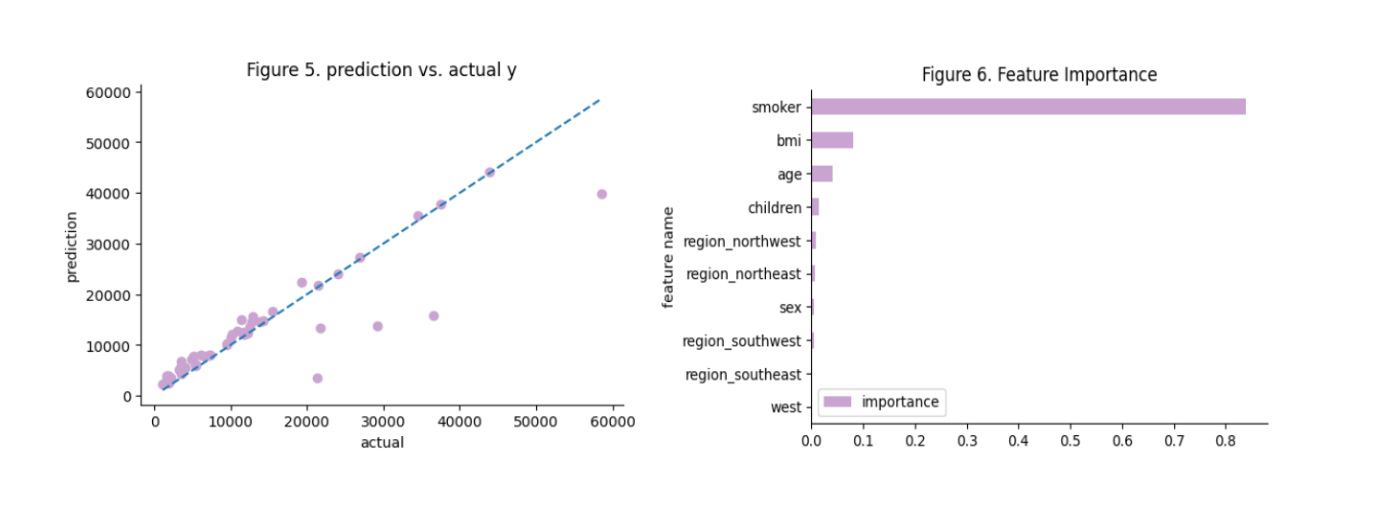
Project 1. Healthcare Insurance Cost Prediction (Regression, Python)
Notebook can be found here: Google Colab
This notebook explores the relationship between individual insurer features and healthcare insurance costs